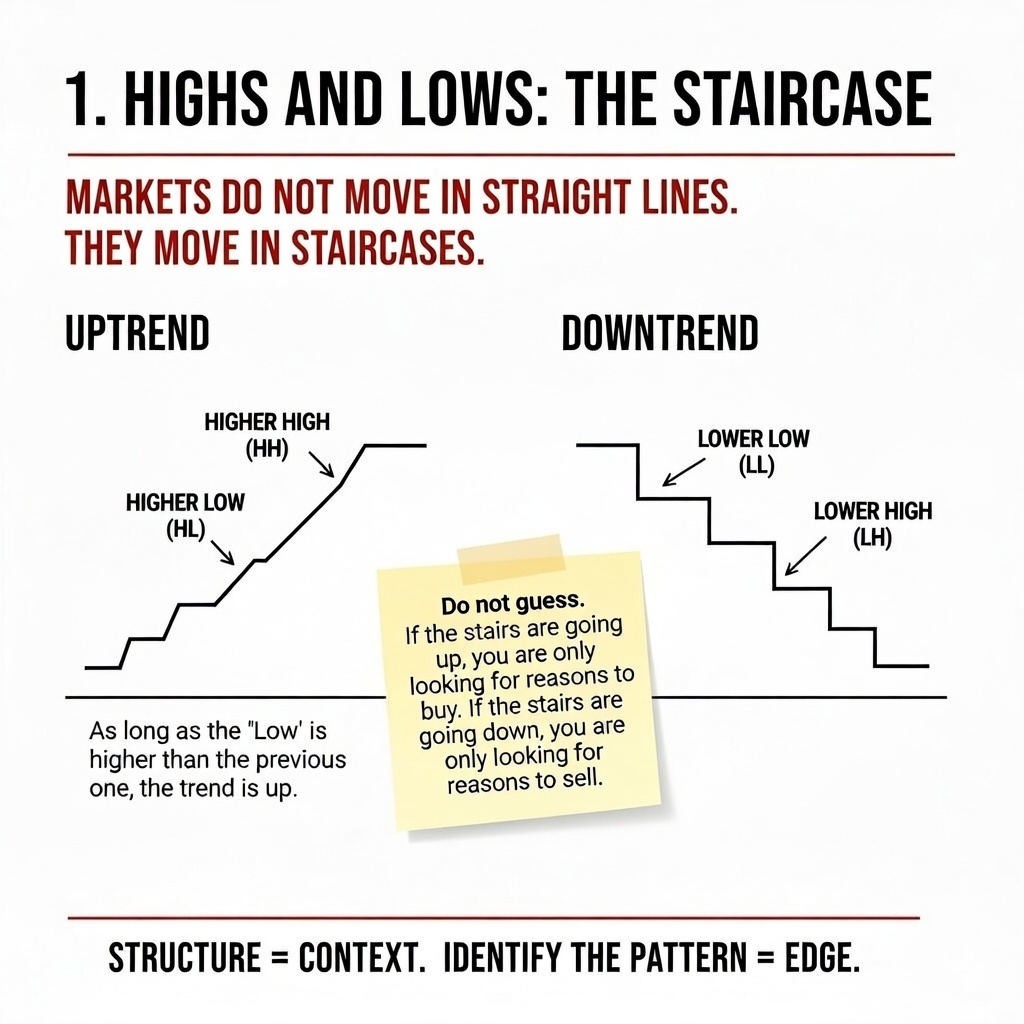
Markets do not move in straight lines. They move in staircases.
Uptrend: The market makes a Higher High (HH) followed by a Higher Low (HL). As long as the "Low" is higher than the previous one, the trend is up.
Downtrend: The market makes a Lower Low (LL) followed by a Lower High (LH).
💡 Sticky Note:Do not guess. If the stairs are going up, you are only looking for reasons to buy. If the stairs are going down, you are only looking for reasons to sell.
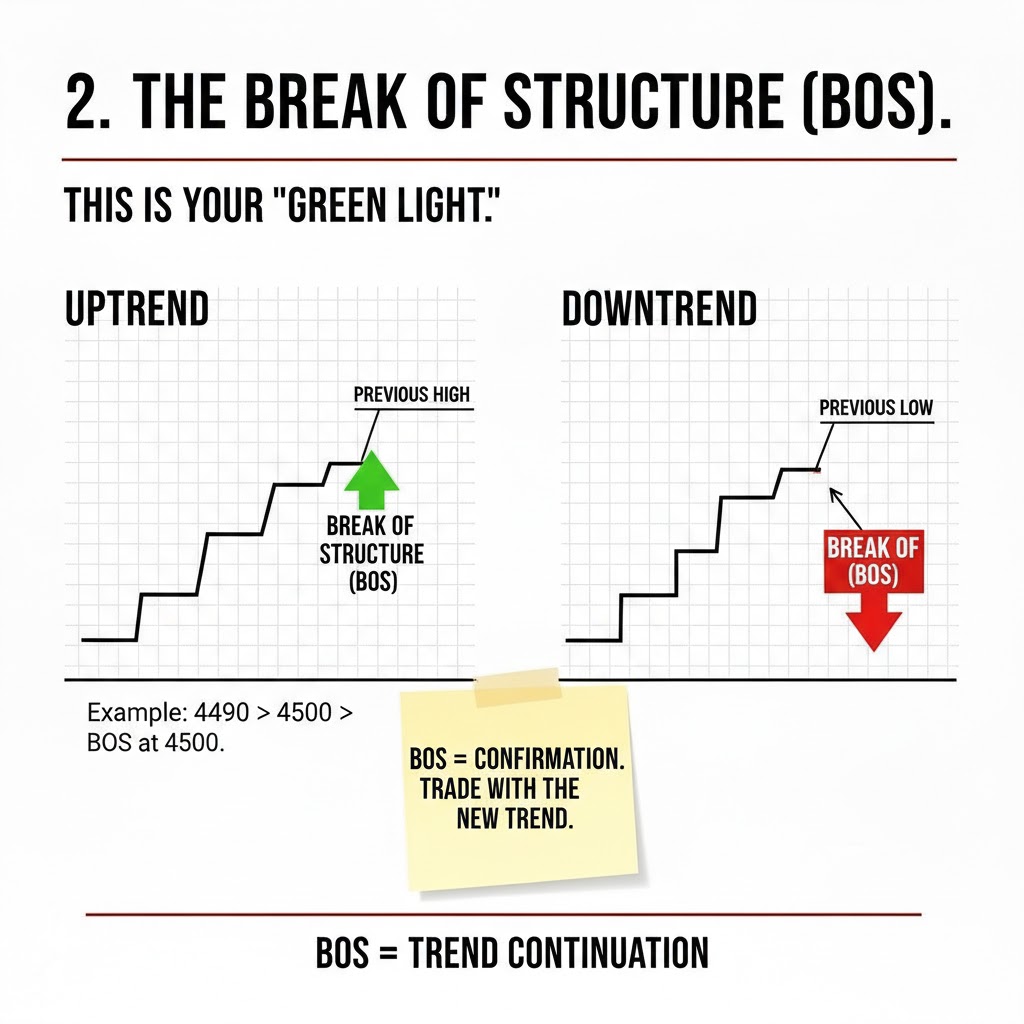
2. The Break of Structure (BOS)
This is your "Green Light."
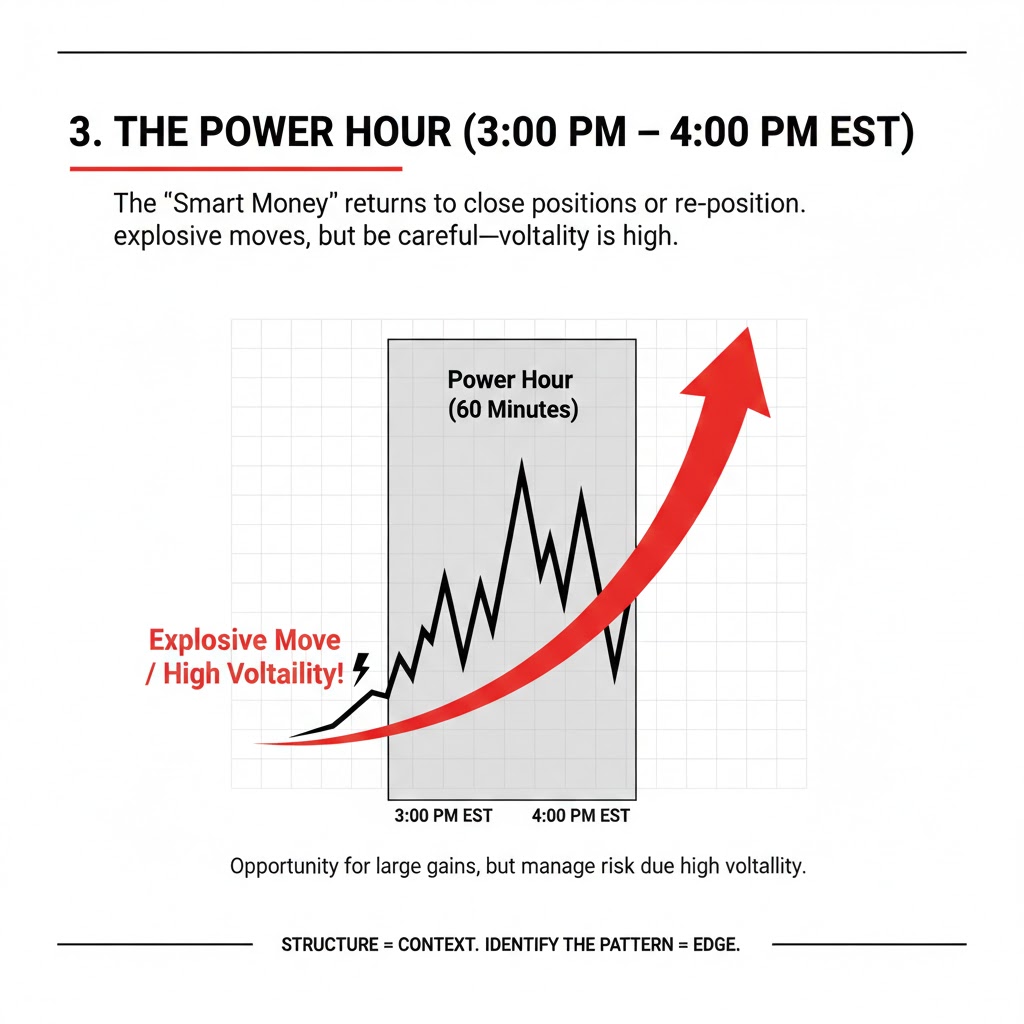
A BOS happens when price breaks above a previous High (in an uptrend) or below a previous Low (in a downtrend).
It confirms that the trend is healthy and continuing.
Example: Price was at 4500. It pulled back to 4490. Then it shot up to 4510. That break of 4500 is a BOS.
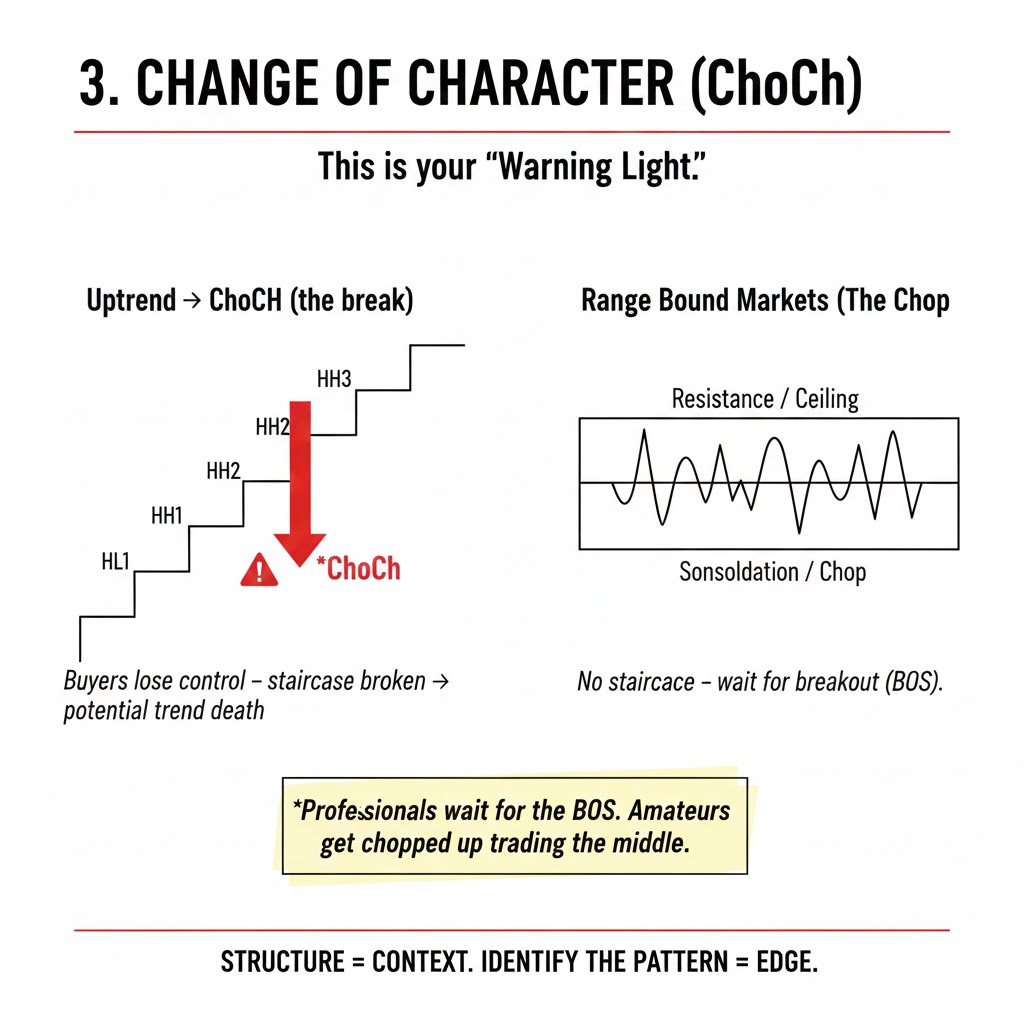
3. Change of Character (ChoCh)
This is your "Warning Light."
A ChoCh is the first sign that a trend might be dying.
Example: In an Uptrend, price has been making Higher Lows. Suddenly, price drops below the last Higher Low. The staircase is broken. The buyers are weak.
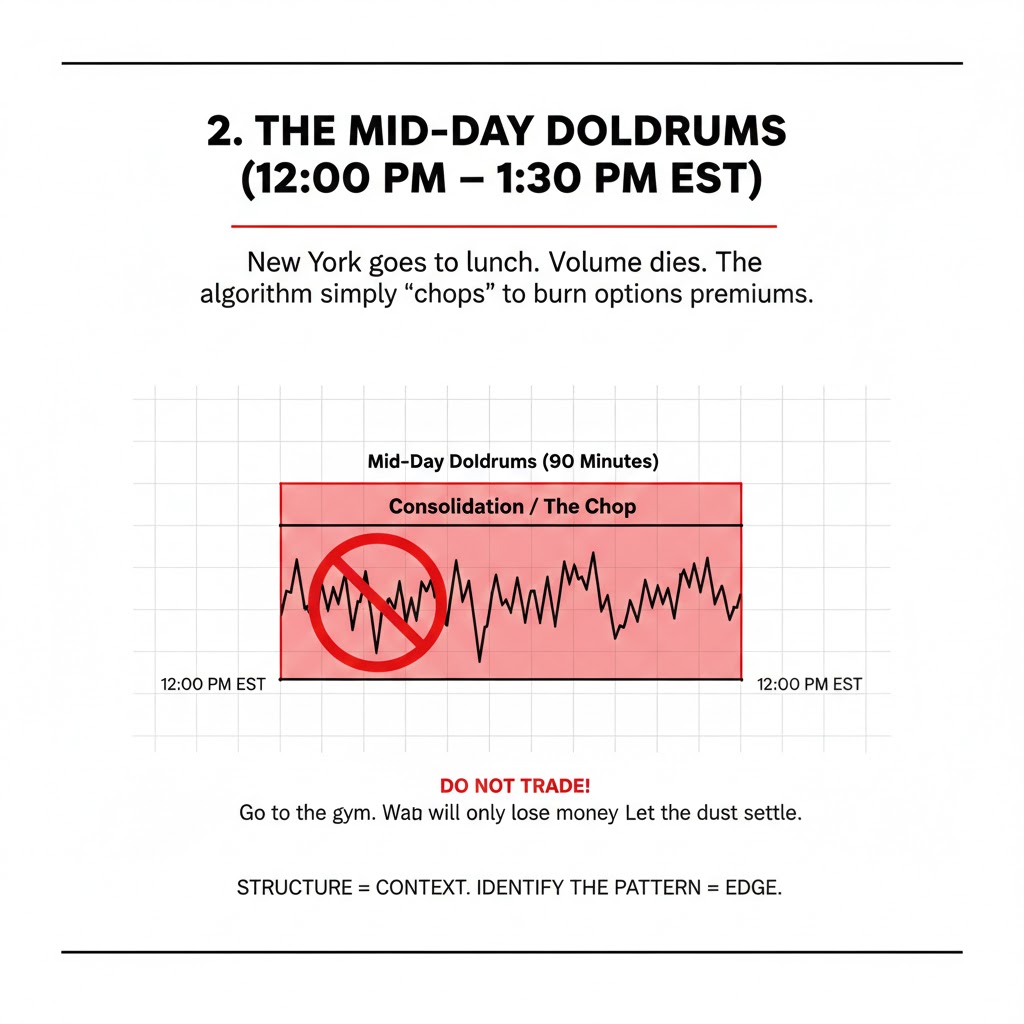
4. Range Bound Markets (The Chop)
Sometimes, there is no staircase. Price is just bouncing between a floor and a ceiling.
This is called "Consolidation."
Rule: We do not trade in the middle of a range. We wait for a breakout.
💡 Sticky Note:Amateurs lose all their money trying to trade the "chop." Professionals wait for the BOS.
Module 02
Liquidity (The Fuel)
Why the market moves where it moves.
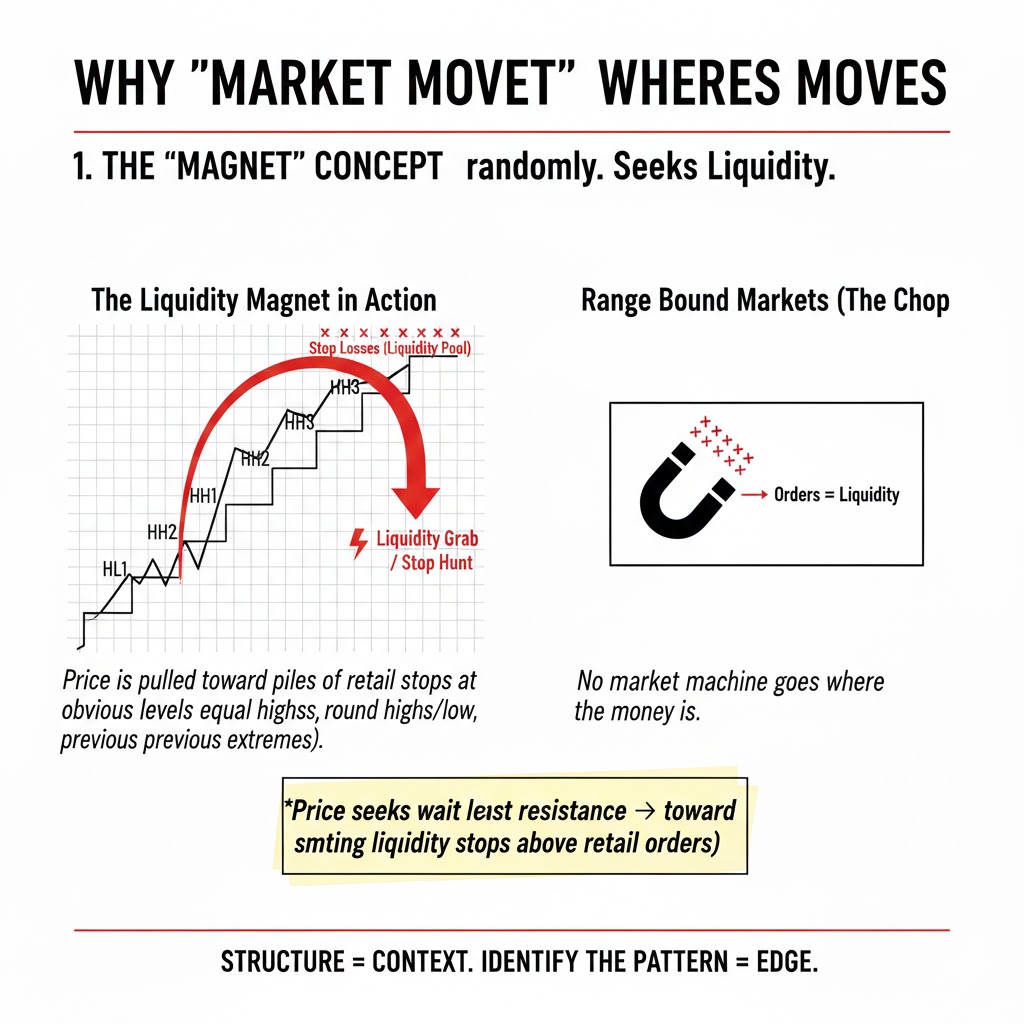
1. The "Magnet" Concept
Price does not move randomly. It seeks Liquidity.
Liquidity = Orders.
Where are the orders? They are sitting at obvious Highs and Lows where retail traders put their Stop Losses.
The market is a machine designed to go where the money is. If there is a big pile of Stop Losses at 4500, price will feel a magnetic pull toward 4500.
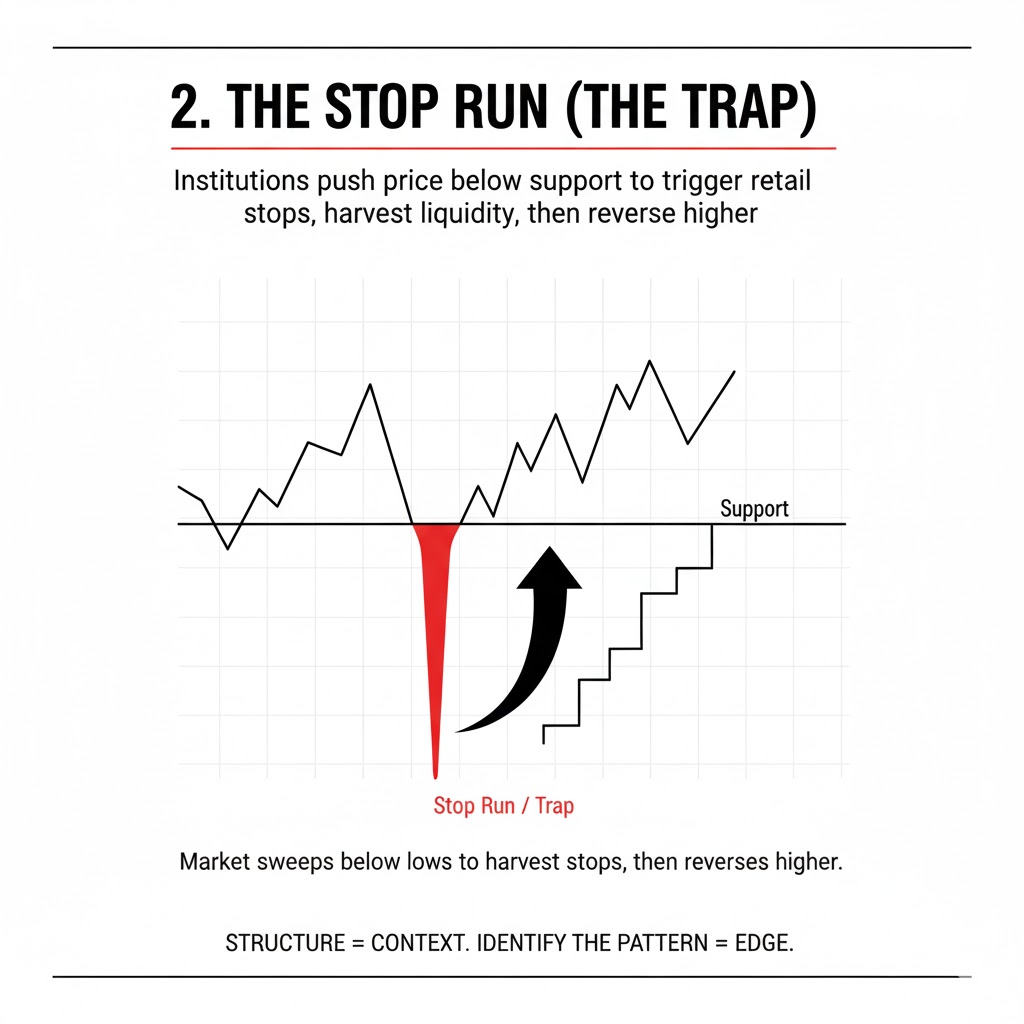
2. The Stop Run (The Trap)
Have you ever bought a support level, got stopped out, and then watched the price immediately reverse and go your way?
That wasn't bad luck. That was a Stop Run.
Big institutions need "Liquidity" to fill their massive orders. They push price below support to trigger your sell stops (which are buy orders for them).
Once they have filled their bags with your cheap contracts, they push the price back up.
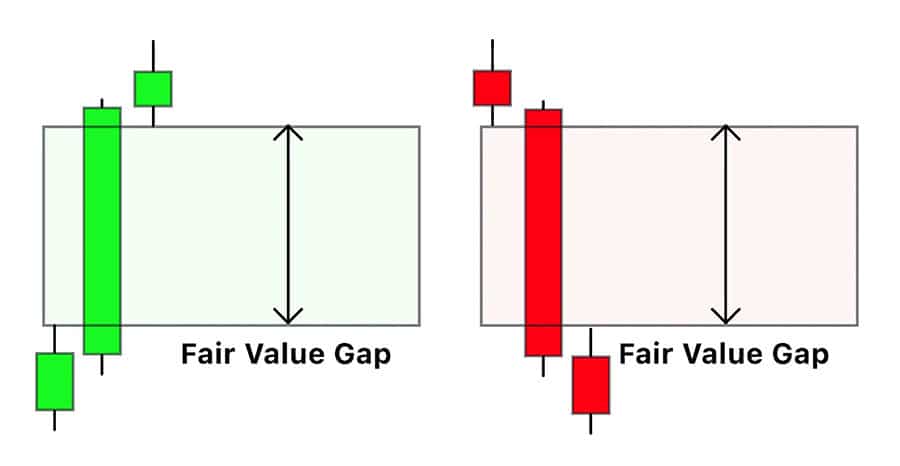
3. Fair Value Gaps (FVG)
Sometimes price moves too fast, leaving a "Gap" where only buyers or only sellers participated.
The market hates inefficiency. It will often return to this "Gap" to fill it before continuing.
Think of it like painting a wall—if you miss a spot, you have to go back and fill it in.
Module 03
Multi-Timeframe Analysis (The Zoom)
Seeing the forest AND the trees.
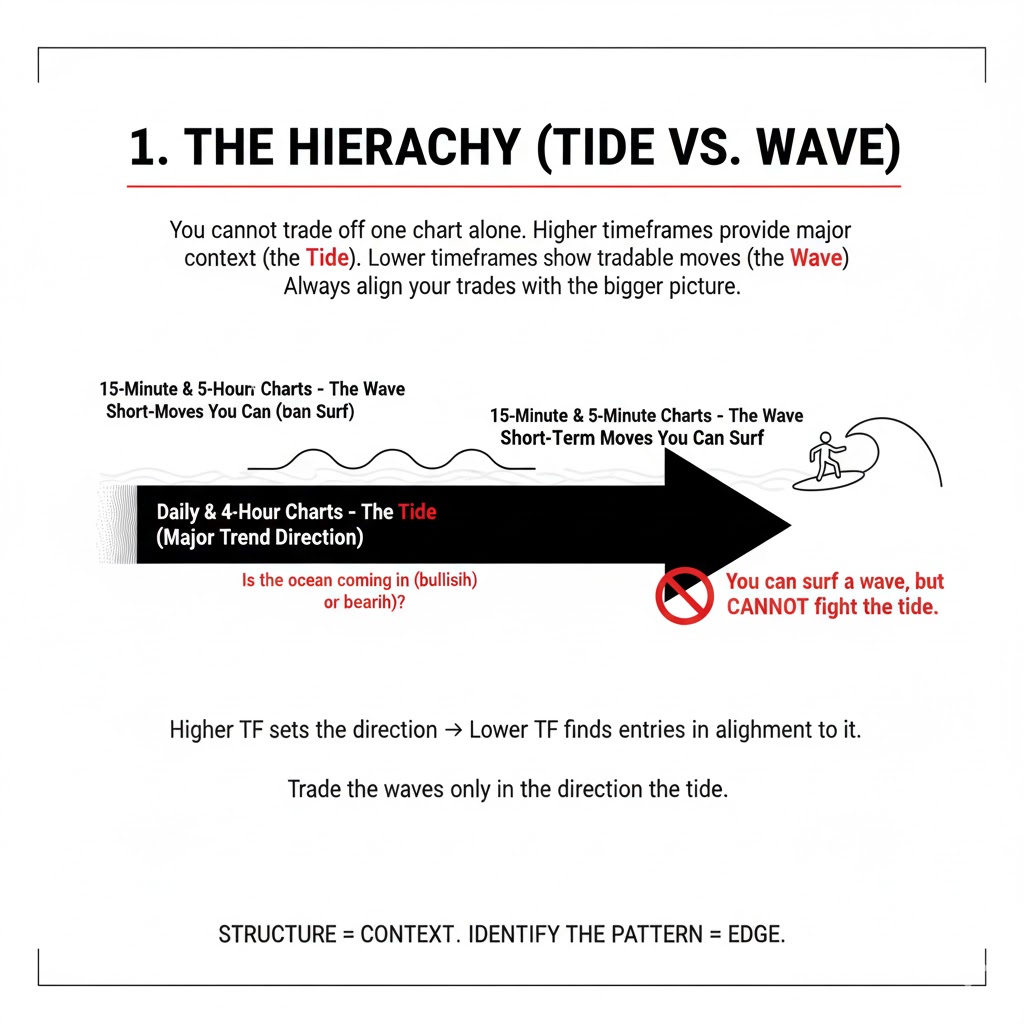
1. The Hierarchy (Tide vs. Wave)
You cannot trade off one chart. You need context.
The Daily/4-Hour Chart: This is the Tide. Is the ocean coming in or going out? (Major Trend).
The 15-Minute/5-Minute Chart: This is the Wave. These are the small moves you surf.
Rule: You can surf a wave, but you can't fight the tide.
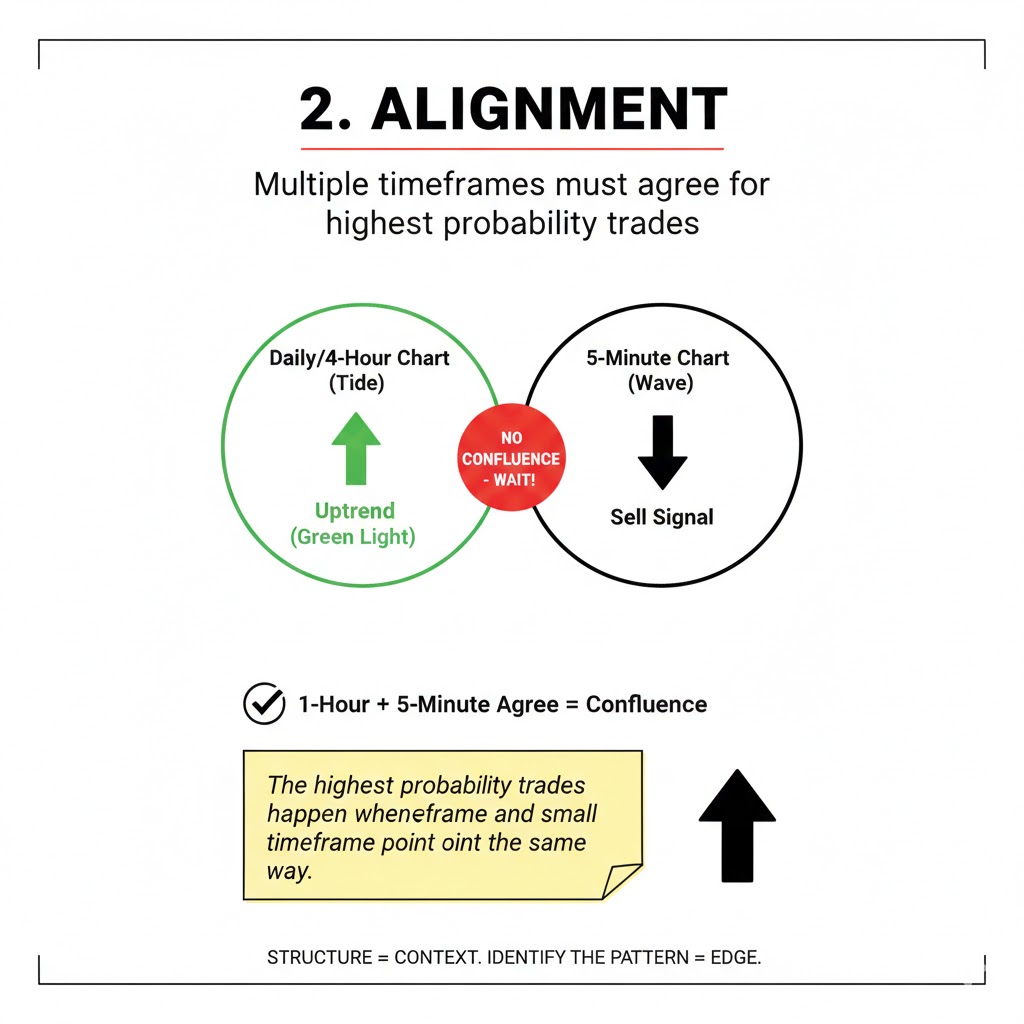
2. Alignment
If the Daily Chart is Uptrending (Green), but your 5-minute chart shows a sell signal... Wait.
You want "Confluence." You want the 1-hour and the 5-minute to agree.
💡 Sticky Note:The highest probability trades happen when the big timeframe and small timeframe point the same way.
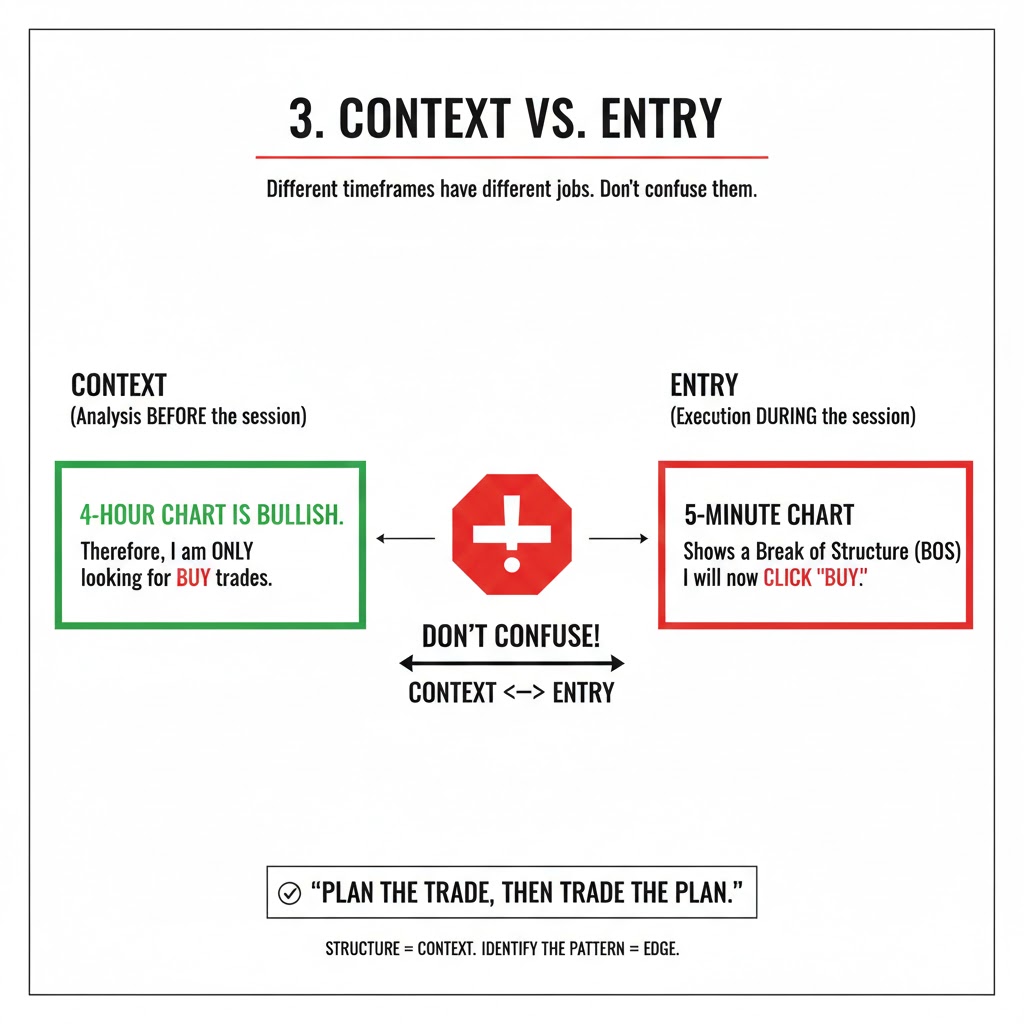
3. Context vs. Entry
Context: "I am looking for Buys because the 4-Hour is bullish." (Do this analysis before the market opens).
Entry: "I am clicking 'Buy' because the 5-minute chart just showed a Break of Structure." (Do this during the session).
Module 04
Advanced Risk (The Math of Winning)
How to be wrong 60% of the time and still get rich.